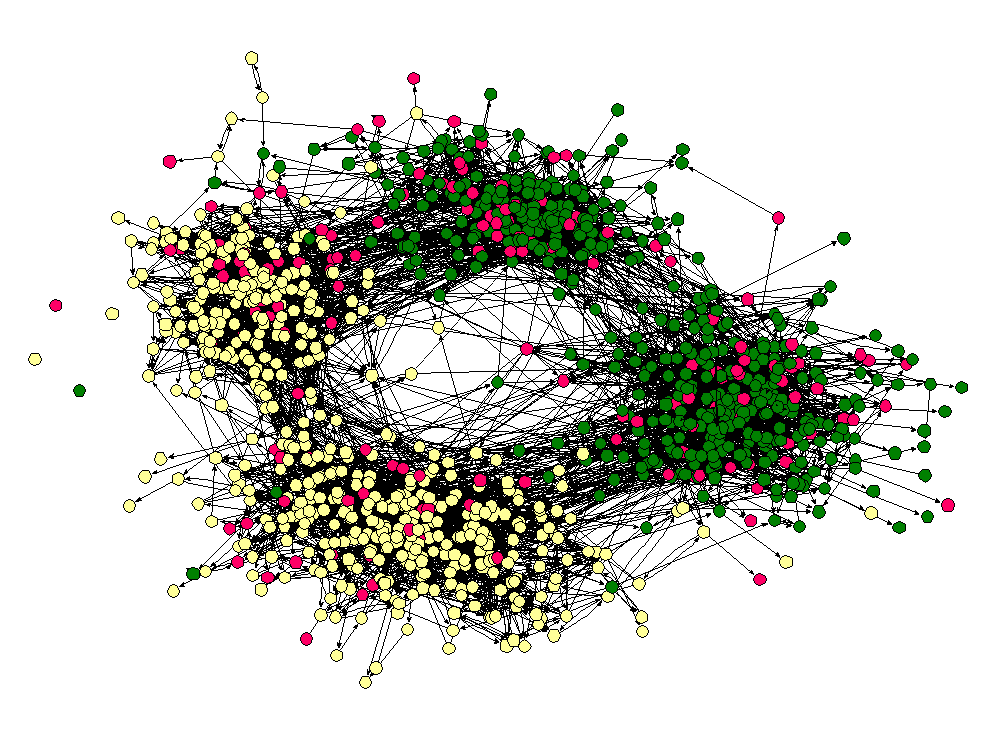
This School Friendship Network plot is from a website called www.visualcomplexity.com. Created by James Moody in 2001, it represents how students of different races associate themselves within certain networks. Here is a description from the website about this project.
Friendship network of children in a US school. Friendships are determined by asking the participants, and hence are directed, since A may say that B is their friend but not vice versa. Vertices are color coded according to race, as marked, and the split from left to right in the figure is clearly primarily along lines of race. The split from top to bottom is between middle school and high school, i.e., between younger and older children.
The colors of the dots in this image represent the following races.
Yellow - White Race
Green - Black Race
Pink - Other
How would you rationalize the splits that occur between ages and races in this plot? How is this plot similar or dissimilar to your online networks? How else could you group together the members of your social network?

No comments:
Post a Comment
Note: Only a member of this blog may post a comment.